Scenario: John teaching properties of 3-D shapes
Country: UK
Grade (student age): Year 9 (age 13-14)
Contributed by: Anne Thwaites, University of Cambridge, UK
Context – national, curricular, professional, other
The National Curriculum for mathematics in England includes solutions of quadratic equations in Key Stage 4 (years 10-11, pupil age 14-16). These pupils were near the end of year 9 and John had been working on graphical representation of quadratic expressions in a previous lesson and then on ‘completing the square’ [i.e. expressing in an equivalent form ], as specified in the 16-18 pupil age curriculum. John was a graduate pre-service teacher, and the lesson took place in a school-based placement towards the end of his one-year teacher preparation.
Scenario
John was teaching in an open entry secondary school (pupil age 11-18) in a small town in the UK. The school divides the year group into maths sets (by ability) and John was teaching the second of nine groups in Year 9 (pupil age 13-14). This was the final lesson in a short sequence. There was a data projector in the room which was connected to a laptop computer: unusually for the UK, there was no interactive whiteboard.
For the initial activity of the lesson, John gave the pupils a series of quadratic expressions and asked them to complete the square. For example, was written as . In the second phase, he reminded the class how equivalent expressions, of quadratic functions, can be achieved by completing the square (CTS), and then aimed to demonstrate some applications of CTS, including drawing the graphs of quadratic functions.
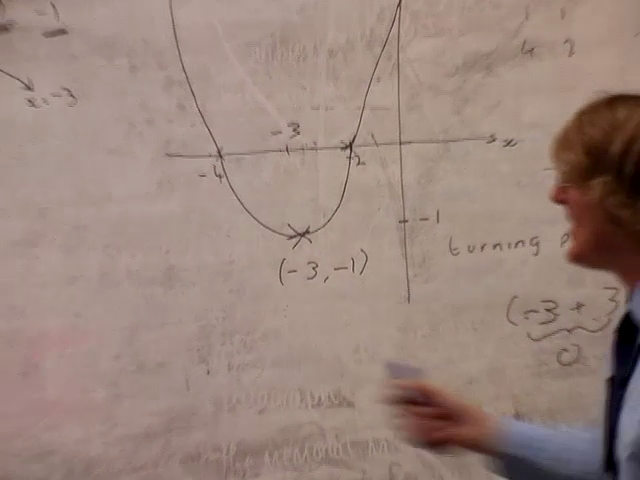
John had planned to use a digital resource, Autograph, with data-projection technology, in the graph-drawing phase of the lesson. However as John was sitting at the PC screen, he shook his head and sighed: he was unable to activate the software. The graph-drawing package, Autograph, was not available to him. So John turned to use a standard whiteboard and a pen to sketch, rather than to accurately draw, the graphs. With the class, he started by finding the zeros of the function by solving, for example, . This gave the crossing points on the x axis and they knew its overall shape ( for this example) enabling the initial sketch (see figure below). Then John used the CTS expression to work out with the class the minimum point of the function and labelled that on the sketch (see second figure below).

In this cycle of our research, we were interviewing the student-teacher after the lesson. During this meeting we viewed episodes from the video of the lesson and one member of the team led a discussion with the student-teacher in the spirit of stimulated-recall. This discussion was audio recorded and was very helpful in coming to an understanding of John’s planned approach.
Reseacher: Might you have approached it differently if Autograph had loaded up?
John: I think the way that I was going to go about it was, because when I am sketching it, I’m the person who is giving them “trust me this is what it looks like” [so] I toyed with the idea of maybe showing the graph and then seeing if we could figure out where these points came from. What I also could have done with Autograph is, I wanted them to recognise that if you factorise a quadratic, you get your two solutions, you can find the minimum point by symmetry … I would have just used it for verification mainly, I think.
Researcher: Do you have any general views about the role of the computer in that way?
John: I was going to use it mainly for verification in this but … if the IT had been there, I would have used the computer because of this ability to zoom in and move the graph around and all this sort of stuff. So as well as for verification, more sort of exploration … but again I lost Autograph, so that went.
Knowledge Quartet Coding Commentary
Contributed by: Anne Thwaites, University of Cambridge, UK
Knowledge Quartet Dimension: Contingency
Knowledge Quartet Code: Responding to (un)availability of tools and resources (RAT)
Scenario: John solving quadratic equations
We use the term ‘contingency’ to capture the idea that a teacher cannot know in advance everything that will happen in a lesson, and at times s/he will be taken by surprise, necessitating some kind of improvisation (e.g. Rowland, 2010). In this scenario, John had planned to use a graph-drawing package in order to allow an inductive, enquiry-based approach to his teaching. However the technology failed – something with which we, the authors, are familiar. But this technology-free exposition made different demands on John’s mathematics-related knowledge and he had to move away from the approach to the pupils’ learning that he had intentionally aimed for. Furthermore, he was forced to make the switch in teaching approach in an instant.
The unavailability of the software removed the possibility of using the interactive nature of the package with the class to ‘move’ graphs around and draw out the links of CTS with its turning point and the zeros of the function. Instead he questioned the class to try to elicit the values of the zeros of the function - they found it hard to connect an expression equal to zero with the crossing points on the axis of the sketch. Autograph would have shown these crossing points and their co-ordinates making the link much more apparent. Further more, the class needed a lot of prompting to make the connection between the CTS and the co-ordinates of the turning point.
Here we have a contingent moment when the unexpected happened and so John had to make rapid changes to his lesson – in particular to his teaching approach. He had intended to conduct an inductive, enquiry-based approach to this section of his lesson but the lack of the graph-drawing facility meant that he had to change approach and resort to a more deductive exposition, albeit with interactive questioning. He had to be clear about the different formulations of the quadratic expression, how these related to the different properties of the function and the values of which made them true. In this instance, the unavailability of the (digital) tool compelled John to draw upon alternative knowledge resources, and forced a significant epistemological accommodation on his part.
References
Rowland, T. (2010) Back to the data: Jason, and Elliot’s quarters. In M.M.F. Pinto & T.F. Kawasaki (Eds.). Proceedings of the 34th Conference of the International Group for the Psychology of Mathematics Education (Vol. 4, pp. 97-104). Belo Horizonte, Brazil: PME.